Five things to know about the January ADP employment report
February 10, 2026


Last week we published the first ADP National Employment Report for 2026. This January release is special because it captures our annual benchmarking, a process that transforms ADP’s expansive payroll data into a nationally representative gauge of private-sector employment.
Here are five things you should know about the NER January release and our benchmarking process.
We benchmark NER data annually
The ADP NER is an independent measure of the U.S. labor market built on the payroll data of a half million employers and their more than 26 million employees.
To calculate employment growth, my team weights raw payroll data by characteristics such as industry, employer size, and geography as measured by the U.S. Quarterly Census of Employment and Wages.
The QCEW, which is released by the Bureau of Labor Statistics, is the most comprehensive measure of U.S. employment, covering more than 95 percent of the workforce. This census of workers is reported with a lag of about five months.
The purpose of the NER is to produce a measure of U.S. employment that is more timely than the QCEW release. Our January 2026 report reflects a scheduled annual reweighting to match QCEW benchmark data by industry, state, and employer size through March 2025.
We’ve updated how we correct for bias
ADP data comes from businesses that have chosen to outsource payroll and human resources activities. As such, our sample of employers tends to be more resilient and faster-growing than the universe of employers as a whole.
To correct for this bias, we adjust the growth rate of establishments in our payroll database to match the population of establishments in the QCEW.
In the past, we applied this forward bias adjustment once a year to match growth rates of establishments in the March QCEW by size, industry, and geography.
Beginning in January 2026, in addition to its annual benchmarking, the NER also reflects data from the most recent QCEW quarterly release. By adjusting the growth bias in the ADP payroll sample more frequently, we can better capture employment changes in real time.
We calculate seasonality by week, not by month
The NER is calculated weekly following an approach similar to the seasonal model used for weekly jobless claims data described by Cleveland, et al., in 2007.i
The last three years of weekly NER data are fit with a daily seasonal signal which is subsampled to a weekly level. This means that each January, for example, is the first time that a particular combination of months (a trailing three-year period, in our case) would have been used to estimate seasonality.
As the seasonal signal evolves, the model updates estimates of its timing, magnitude, and direction. For any particular January, the updated model will contain only two of the three years of NER data used to estimate the previous seasonal signal. This allows for considerable variability between seasonal estimates for each January.
NER historical data now reflects the granular detail of the first-quarter QCEW
With its January 2026 release, the NER historical file were updated to reflect the 2025 first-quarter QCEW.
In October, we noted that the March 2025 QCEW release from the Bureau of Labor Statistics contained a higher-than-normal number of missing or redacted values for establishment size by sector and geography. As a result, ADP was required to benchmark the NER at a coarser granularity than we had in previous years.
Because our seasonally adjusted estimates require a three-year look back, we adjusted the entire NER history file to reflect this coarse granularity.
The NER and the NER Pulse are the same data series
In October 2025, we began publishing estimates of the week-over-week change in employment, a series we call the NER Pulse.
This near real-time employment tracker has been embedded in our NER data for the past four years. When we retooled the monthly NER with our partners at the Stanford Digital Economy Lab in 2022, we recognized the value of a high-frequency snapshot of employment trends.
As the labor market adapts to artificial intelligence, demographic change, and business cycle fluctuations, the NER Pulse of private-sector hiring provides a dynamic view of job creation and loss at an unprecedented weekly frequency.
The NER Pulse averages the NER’s weekly change in employment over a trailing four-week period. So, the NER Pulse employment change for the week ending January 31, 2026, will be the average of the weekly employment changes for January 31, January 24, January 17, and January 10.
Most ADP clients process their payroll weekly, biweekly, semi-monthly, or monthly. These differences in pay frequency lead to higher variability in the employment change estimates for the most recent six weeks of the NER Pulse. We address this variability in the monthly NER publication by withholding the last six weeks of the weekly NER Pulse series from the NER history file.
We reduce this variability for the NER Pulse by withholding the last two weeks of data, reporting the average of the past four weeks of employment change, and by reporting only the top-level national number, which converges most quickly.
The monthly NER series can be constructed from the weekly series by subsampling
to the reference weeks, although the monthly series is already present in the history file.
Job creation is just part of a healthy labor market. Wages are a second critical component. Next week, we’ll dive into our payroll data to share five things you need to know about ADP Pay Insights.
ADP principal data scientist Tim Decker contributed to today’s Main Street Macro.
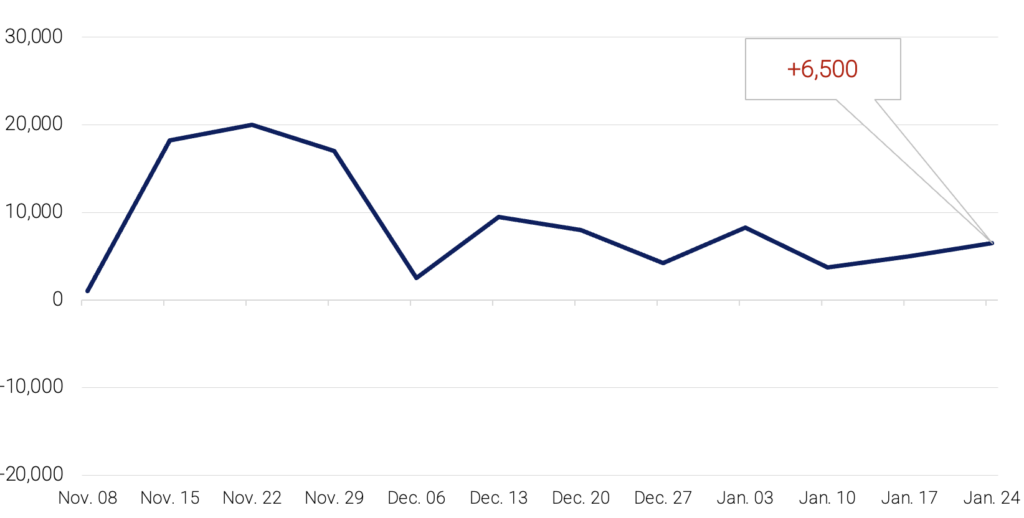
THE NER Pulse
For the four weeks ending January 24, 2026, private employers added an average of 6,500 jobs a week, a step up in hiring from the previous week. These numbers are preliminary and could change as new data is added.
This week’s NER Pulse reflects our January benchmark to March 2025 QCEW data.
These numbers are preliminary and could change as new data is added.
About The NER Pulse
Three times a month, Main Street Macro releases the NER Pulse, an estimate of the week-over-week change in employment based on a four-week moving average. These releases are seasonally adjusted and have a two-week lag to allow for more complete and accurate estimates of real-time employment trends. At the beginning of each month, we publish the National Employment Report, which is built on a reference week that includes the 12th day of the month. We do not publish the NER Pulse during NER release weeks.
Download this week’s NER Pulse data
The week ahead
Tuesday. The data-packed week kicks off with that big driver of economic growth, consumer spending. The Census Bureau’s delayed December retail sales report will provide an indication of whether consumer health remained resilient at the end of 2025.
Wednesday. The delayed BLS employment report for January will reflect the bureau’s annual benchmark of the data.
Thursday. The Department of Labor will release weekly jobless claims data. Initial claims rose in the last week of January but remain at historically low levels. Also today, we’ll get a December read on housing sales with the National Association of Realtors existing sales report. I want to know if the housing market continued to thaw with a return of new listings and rising inventory.
Friday. In both November and December, consumer prices rose by an annualized 2.7 percent. The BLS Consumer Price Index for January will show us whether the pace inflation changed.
In case you missed it. Last week, I joined Andy Cates from Haver Analytics for a deep dive into the ADP National Employment Report and our recently launched NER Pulse. Webinar
