How representative is ADP employment data?
October 30, 2025
by Erik Brynjolfsson, Ph.D. and Nela Richardson, Ph.D.


Erik Brynjolfsson, Ph.D., is the Jerry Yang and Akiko Yamazaki Professor and Director of the Stanford Digital Economy Lab at the Stanford Institute for Human-Centered Artificial Intelligence. ADP chief economist Nela Richardson, Ph.D., runs ADP Research. Both contribute to the production of the monthly ADP National Employment Report.
Private-sector data is taking on greater importance as a measure of the economy. As its influence grows, it’s essential to understand the size, scope, and representation of these data sets.
In this note, we examine one of these data series, the ADP National Employment Report (NER) for private-sector payrolls, to assess how well it represents the U.S. workforce.
We compare ADP’s administrative payroll data to the universe of U.S. employees as measured by the Bureau of Labor Statistics (BLS) Quarterly Census of Employment and Wages (QCEW). We also compare ADP data to the BLS Current Employment Statistics (CES) survey data, which is used to construct the BLS non-farm payroll report each month.
The ADP and BLS employment reports are both benchmarked to the QCEW each year. When we look at monthly revisions of the ADP and BLS reports for the first half of 2025, the final estimates are within a very narrow range.
We underscore the importance of the ADP employment estimate as a private-sector supplement to government labor statistics. We demonstrate that ADP data is representative of the U.S. workforce and highlight advantages of ADP data in capturing hiring at small and medium employers at a weekly frequency.
Two estimates, one benchmark
The ADP National Employment Report was launched in 2006 as a modeled estimate of the monthly nonfarm payrolls measure from the Bureau of Labor Statistics. In 2022, ADP retooled the NER in partnership with the Stanford Digital Economy Lab to create an independent measure of U.S. private-sector employment.
The ADP and BLS data series tend to move in the same direction, but their counts can diverge in any given month due to differences in their underlying data and methodologies.
Both the ADP and the BLS estimates are benchmarked to the first-quarter release of the QCEW, which provides granular information on employment by industry, employer size, and geography.
The QCEW captures more than 95 percent of U.S. employment, but it is unavailable to the public until five or six months after the end of each quarter. For that reason, both the ADP and BLS estimates can be thought of as a timely estimate or nowcast of the QCEW.
ADP’s convenience sample
ADP provides payroll services for more than 26 million U.S. workers at more than 500,000 employers, or 1 in 6 workers in the country and 1 in 5 workers in the private sector.
ADP data includes real-time payroll transactions, including when and how much a person is paid. It contains administrative information such as the number of unpaid workers on payroll, and characteristics of employers and employees.
ADP’s business-level database provides aggregated counts of employment at the level of an ADP payroll account. An ADP client company might have one or more payroll accounts. As an approximation, ADP considers a payroll account to be a business establishment, or company work location.
ADP also uses an individual-level database of payroll transactions that enables us to construct a matched-persons sample to measure change in wages or earnings over time.
ADP data can show how many people are on a company payroll (active employment) and how many people were paid in a given period (paid employment). Both measures are of interest and together provide a richer understanding of the labor market.
Our active employment series is unique. During the pandemic, for example, many workers remained on employer payrolls but weren’t paid.1The paid employment series has been shown to be useful in measuring the real-time impact of abnormal conditions, such as during the pandemic or extreme weather events.
The ADP National Employment Report leans heavily on this active employment series, which is less volatile and better at estimating the universe population of the QCEW during normal economic conditions. The monthly NER is a snapshot of active employment taken during the week that contains the 12th day of the month. This is the same reference week used by the BLS Current Employment Statistics survey.
The NER also releases weekly data containing seasonally adjusted and non-adjusted information on employment by industry, employer size, and geography for all weeks prior to the release month going back to January 2010. This weekly data is released with a one-month lag.
The NER’s weekly count is helpful in assessing the impact of natural disasters, worker strikes, or other events that create short-term employment disruptions outside the BLS and NER reference weeks.
Because ADP payroll databases are updated continuously, they can be used to generate a near real-time measure of U.S. employment. ADP payroll data at the individual level, in concert with establishment-level data, enables more detailed, richer analysis.
The NER is based on a convenience sample of ADP clients, which might or might not fully correspond to the broader universe of U.S. employees. ADP establishments lean larger than the national distribution and are concentrated in manufacturing and the Northeast.
On October 28, ADP Research began publishing, the NER pulse, a weekly tracker of private-sector U.S. employment. As artificial intelligence, demographic change, and short-term business cycle fluctuations exert their pull on the economy, our high-frequency NER pulse provides a near real-time view of job creation and loss.
The QCEW universe population
The QCEW can be used to determine the degree to which ADP payroll data is representative of the U.S. workforce.
The QCEW is a tabulation of data on establishments and employees covered by state unemployment insurance laws. The QCEW is a count of these covered workers who have been paid in a given month.
An ideal employment estimate would combine the timeliness and granularity of the ADP National Employment Report and the comprehensiveness of the QCEW to generate a weekly census of employment in the United States. We can approximate this ideal by tapping the strengths of these two data sources.
BLS Current Employment Statistics
The BLS monthly employment report is based on data from the Current Employment Statistics survey, which is designed to be a statistically representative sample of the universe population of QCEW establishments. The CES survey asks employers to report a count of workers paid during a reference week (the week of the 12th day of the month).
ADP payroll data and BLS survey data both provide timely measures of the labor market in advance of the lagged release of the QCEW.
Comparing ADP and BLS employment estimates
ADP and BLS each benchmark their employment data to the QCEW when it becomes available. Most recently, QCEW data were released for the months of April 2024 to March 2025. The March 2025 QCEW provides a basis for evaluating the representativeness of the ADP administrative data sample and the BLS survey data sample.
Figure 1 shows the distribution of the ADP and BLS samples and the QCEW universe by NAICS supersector.2See appendix for detailed tables.
Figure 1
In Table 1 of the Appendix, the ADP columns show share of payroll by supersector for both the active employee and paid employee series. For example, of ADP’s total sample of 26 million active employees, 4.6 percent work in construction. ADP payroll accounts are roughly analogous to QCEW establishments.
The BLS column shows the share of BLS private-sector employment by supersector. BLS reports a total sample of 25.4 million private employees; workers in construction make up 2.7 percent of the sample.
The QCEW columns show the share of QCEW private-sector employees by supersector. The QCEW has a total sample of 131.3 million private-sector workers, 6.1 percent of whom work in construction.
ADP control samples are aligned with the QCEW across most industry classifications. The biggest difference in ADP payroll accounts vs. QCEW establishments is in manufacturing, where ADP overrepresents QCEW (9 percent versus 3.5 percent).
We also compare the ADP sample by paid and active employment. Again, these shares are roughly aligned to the QCEW, with the biggest divergence in manufacturing.
Differences at the industry level also occur between the BLS sample and the QCEW population. The biggest divergence is in trade, transportation, and utilities, which accounts for 32.9 percent of employment in the BLS sample but only 21.6 percent of employment in the QCEW.
We also can compare representation based on employer size. As shown in Figure 2, the BLS survey sample overrepresents large employers and underrepresents smaller ones when compared to the QCEW.
Figure 2
The ADP sample is more representative of employment for small and medium employers than the BLS survey.
For example, as seen in Table 2 of the Appendix, employers with fewer than 50 people make up 32.4 percent of active employees, 31.3 percent of paid employees, and 87.5 percent of payroll accounts in ADP data. This compares to 43.9 percent of employment and 96.3 percent of establishments in the QCEW sample.
The BLS survey sample of employers with fewer than 50 workers is less than 3 percent.
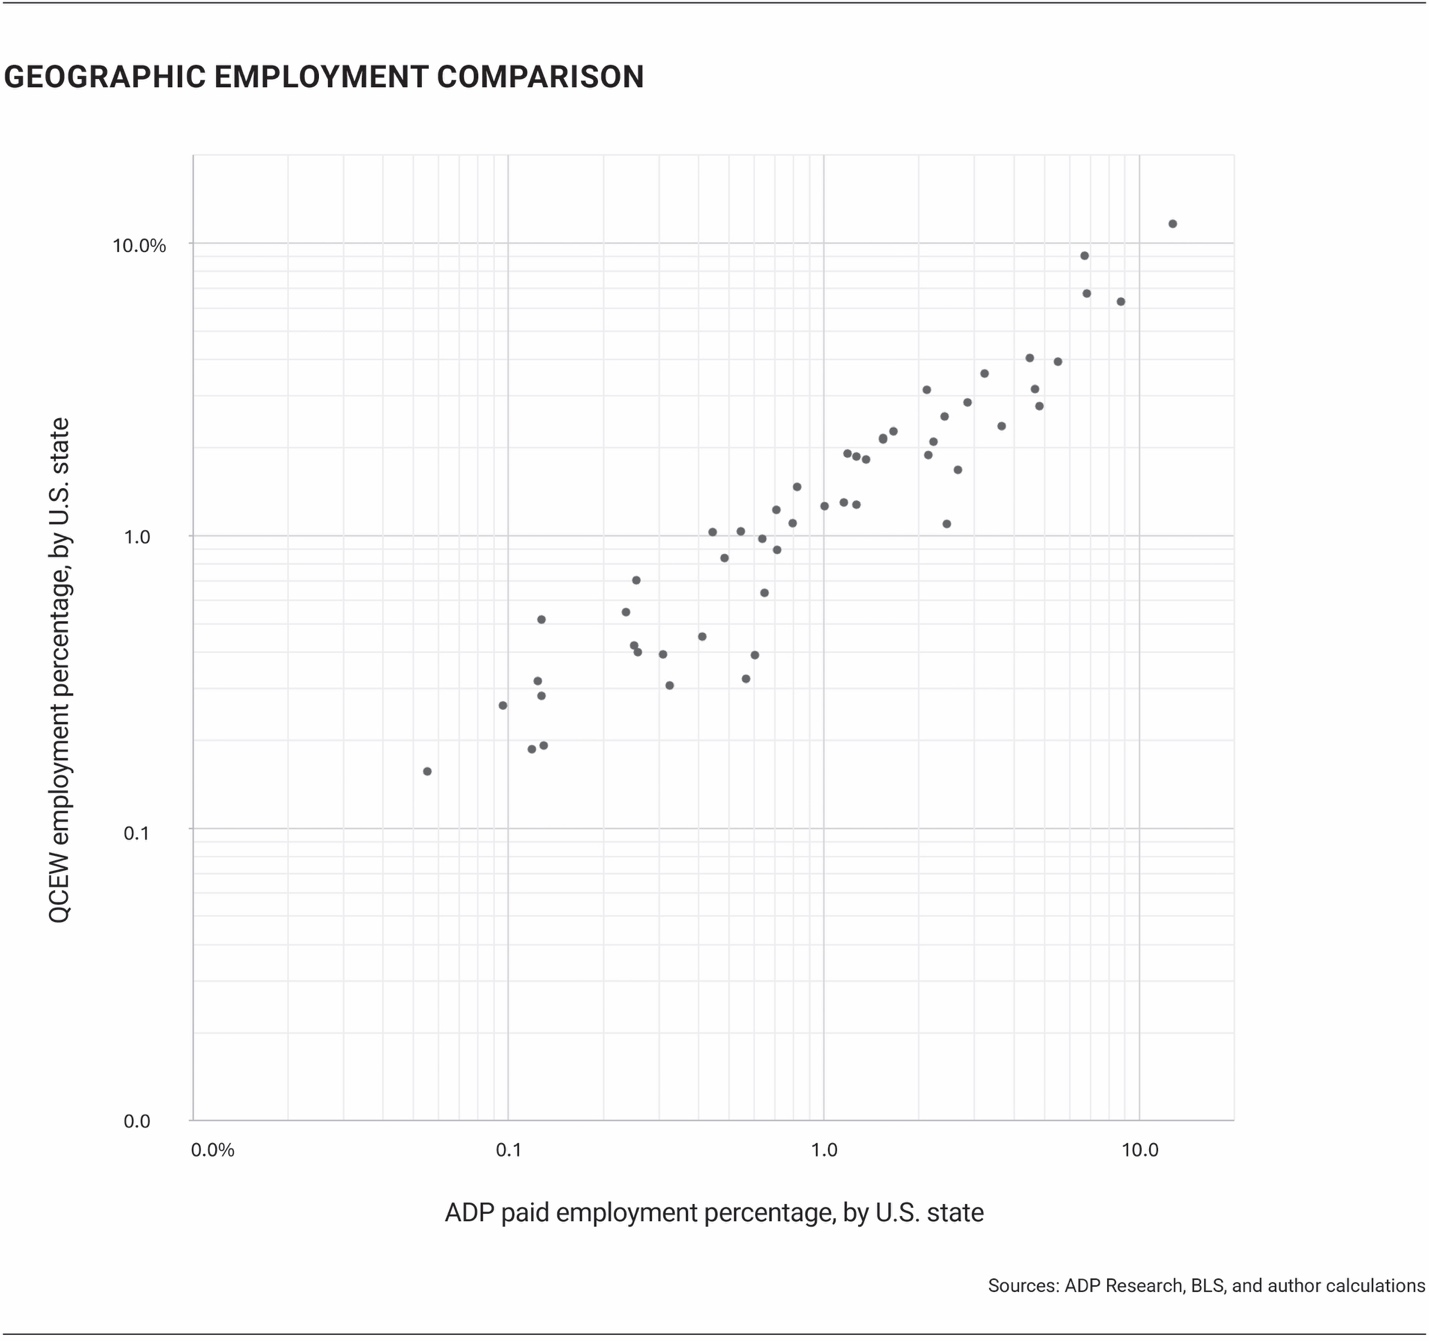
When comparing data by U.S. county-level Federal Information Processing System (FIPS) codes, the ADP sample is in line with that of the QCEW. The BLS survey does not provide this geographic information.3See appendix for detail on geographic comparisons.
To create a representative measure of national employment, ADP uses QCEW employment by industry, U.S. state, and employer size to re-weight the ADP employment measures in the corresponding industry-state-size cells.
We also use the QCEW to correct for ADP’s growth bias, which is generated by the self-selecting nature of ADP clients. Employers that outsource payroll services are likely to be more profitable than those that don’t, and ADP clients tend to grow faster than employers in the broader market. We correct for this bias by adjusting the growth rates of the ADP sample to reflect QCEW dimensions by industry, state, and size.4For more details about ADP’s bias correction method, please see our recent post on bias in data.
Response rates, collection rates, and revisions
The BLS survey response rate can affect the accuracy of its representation of the QCEW population. The CES survey response rate is defined as employers that have agreed to provide data divided by employers selected for the survey. This concept differs from the CES collection rate, which is defined as employers that have provided data by a given date divided by employers that have agreed to provide data. CES response rates have fallen from about 58 percent before 2020 to 43 percent in 2024.
The bureau’s revisions to its nonfarm employment report are tied to the collection rate. Monthly collection rates for 2024 averaged 60.4 percent for first estimates, 89 percent for the revised second estimates, and 90.9 percent for final estimates.
For BLS nonfarm employment, in data from 1979 to the present, the mean monthly revision was a subtraction of 11,000 jobs (-11,000).
In August 2025, the BLS reported an unusually large revision to its May and June estimates. The third and final total for the two months subtracted a combined 280,000 jobs from the initial preliminary estimate. Almost half the revisions were from state and local government employers, primarily in education.
BLS and ADP both revise their initial estimates. ADP estimates are revised once, primarily to capture active employees who are paid monthly and are seen in the data set after the reference week for a given month.
BLS revises its initial estimates two times to incorporate survey data that arrives over the course of its collection period.
Figure 3 shows original and revised BLS and ADP data from January to June 2025. This period includes all third and final revisions by the BLS year to date and captures estimates prior to the annual QCEW benchmarking.
During this time period, revisions have lowered the BLS employment estimate by about 488,000 jobs.5BLS revision data are available on the bureau’s website.
Figure 3
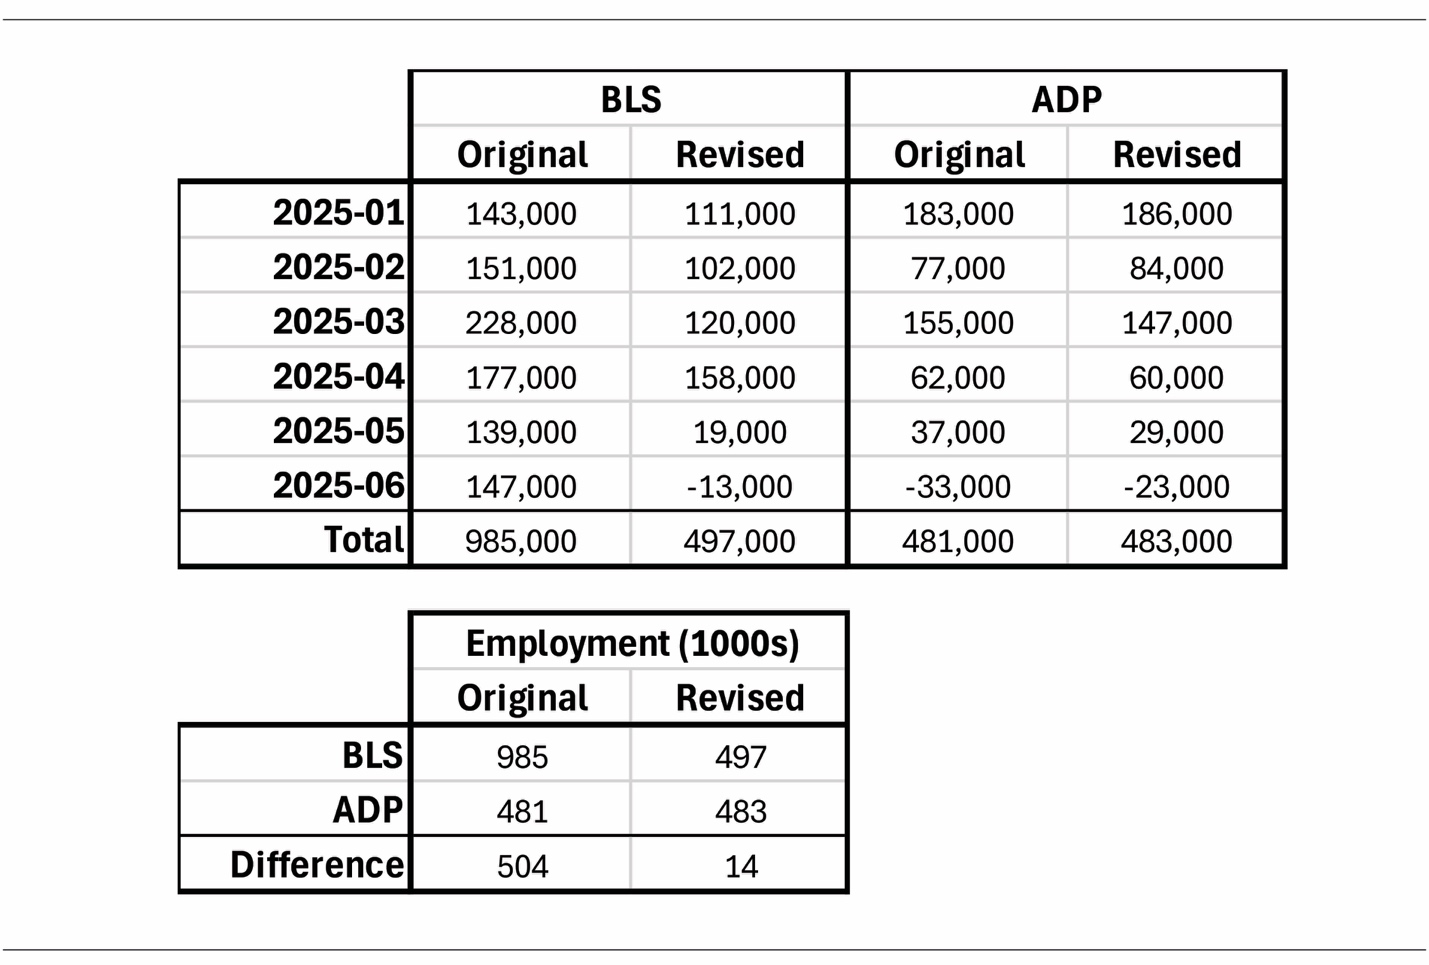
By comparison, ADP’s upward and downward revisions have nearly balanced out, yielding a net revision of 2,000 jobs.
At the end of this six-month window, the BLS had revised its initial estimates downward to end up with just 14,000 jobs more than the ADP employment measure for the time period.
Conclusion
ADP’s National Employment Report, which re-weights the raw payroll data by observable characteristics like industry and geography is overall representative of U.S. employment as measured by the QCEW. ADP payroll data also has the advantage of capturing employment at small and medium establishments better than BLS survey data, and at a higher frequency than the BLS nonfarm payrolls report and quarterly QCEW releases.
Moreover, as demonstrated, revisions typically moved the BLS estimates closer to the ADP series during the first half of 2025.
The BLS nonfarm payroll report and ADP National Employment Report are independent of one another. Each measures a different aspect of employment and uses a different methodology.
Both, however, are anchored to the QCEW, a nearly complete census of employment that is provided by the BLS. This means that over time the two series are likely to trend in the same direction and together could comprise an informative portfolio of private- and public-sector data with different snapshots of the U.S. labor market.
Anchoring ADP’s representative, large-scale, and high-frequency private-sector data to the QCEW’s national benchmark allows us to combine the strengths of both data series and mitigate their weaknesses. This powerful ability makes the ADP National Employment Report a timely and reliable gauge of private-sector employment that can be used to support public policy and business decision-making.
Appendix
Table 1: Comparison by supersector

Table 2: Comparison by establishment size, March 2025

Table 3: Geographic comparison


Figure A.1